Tanzania Economic Intelligence Dashboard
- Power BI
- Power Query
- DAX
- Excel
- BoT, NBS & TRA open data
Problem
Tanzania’s key economic indicators live scattered across separate Bank of Tanzania, NBS, and TRA publications, making trend analysis slow and manual.
Approach
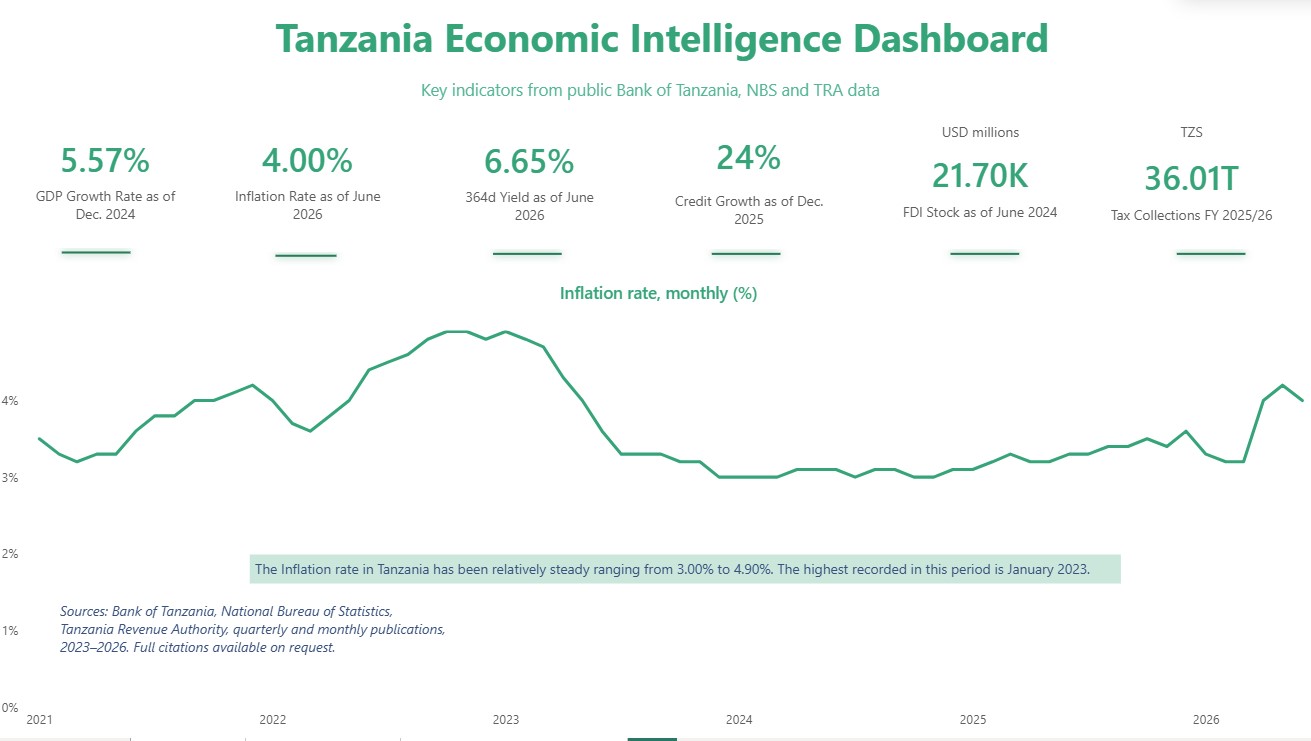
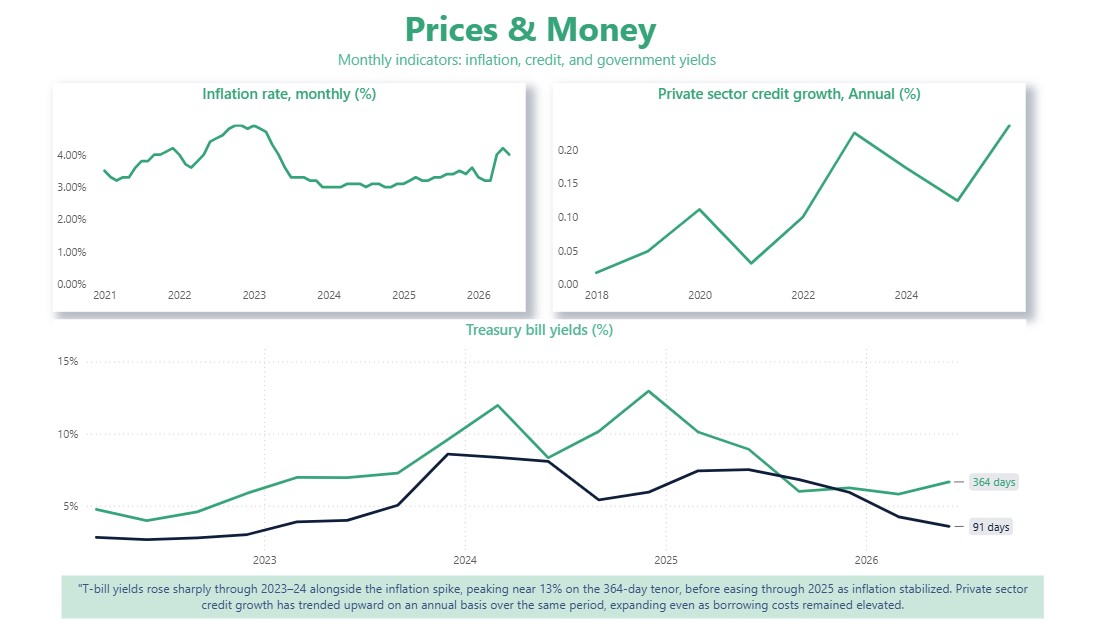
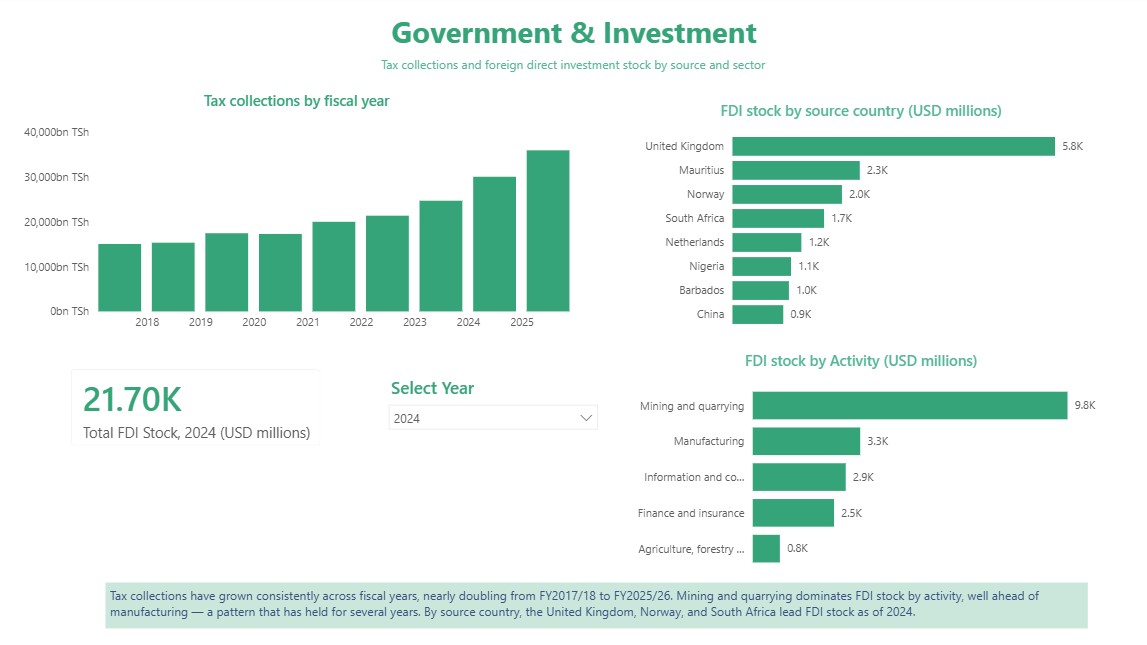
Consolidated six public indicators (GDP growth, inflation, tax collections, private sector credit, treasury bill yields, and FDI stock by source country and activity) into a three-page Power BI dashboard built on a star schema with a central date table.
Outcome
A dashboard spanning 2014–2026 that surfaces the story behind the numbers: inflation cooling from a 4.9% peak in January 2023, T-bill yields tracking that same tightening cycle, tax collections nearly doubling since FY2017/18, and FDI stock concentrated in mining despite China’s growing share of inflows.
Dashboard pages